Market Leading Brands
Top EV Models


Market Overview
This interactive analysis sets the stage for comparing electric vehicle (EV) markets in China and the United States—the two global leaders in scale and influence. The contrasts in market size, pricing strategies, and consumer adoption reveal distinct pathways to electrification, which are examined in detail through the data and tables that follow.
Global Context
China accounts for over 60% of global EV sales, while the U.S. contributes roughly 8%. Together, they shape the trajectory of global mobility—China through mass accessibility and the U.S. through premium-focused innovation.
Market Dynamics
China's EV sales surpass 11 million units annually, compared to 1.3 million in the U.S.—an 8.5:1 ratio. This scale advantage reflects China’s aggressive policy push and broad offering of affordable options.
Price Philosophy
Average EV prices in China ($15,000-$25,000) are less than half those in the U.S. ($45,000–$55,000), underscoring different strategic approaches and consumer expectations in each market.
Consumer Adoption
EVs represent more than 35% of new car sales in China versus just 7% in the U.S. These adoption curves—shaped by pricing, infrastructure, and cultural readiness—will be further illustrated in the comparative data below.
China: Over 11 million EVs sold (35% market penetration)
U.S.: ~1.3 million EVs sold (7% market penetration)
Price Gap: 2-3x difference in average vehicle cost
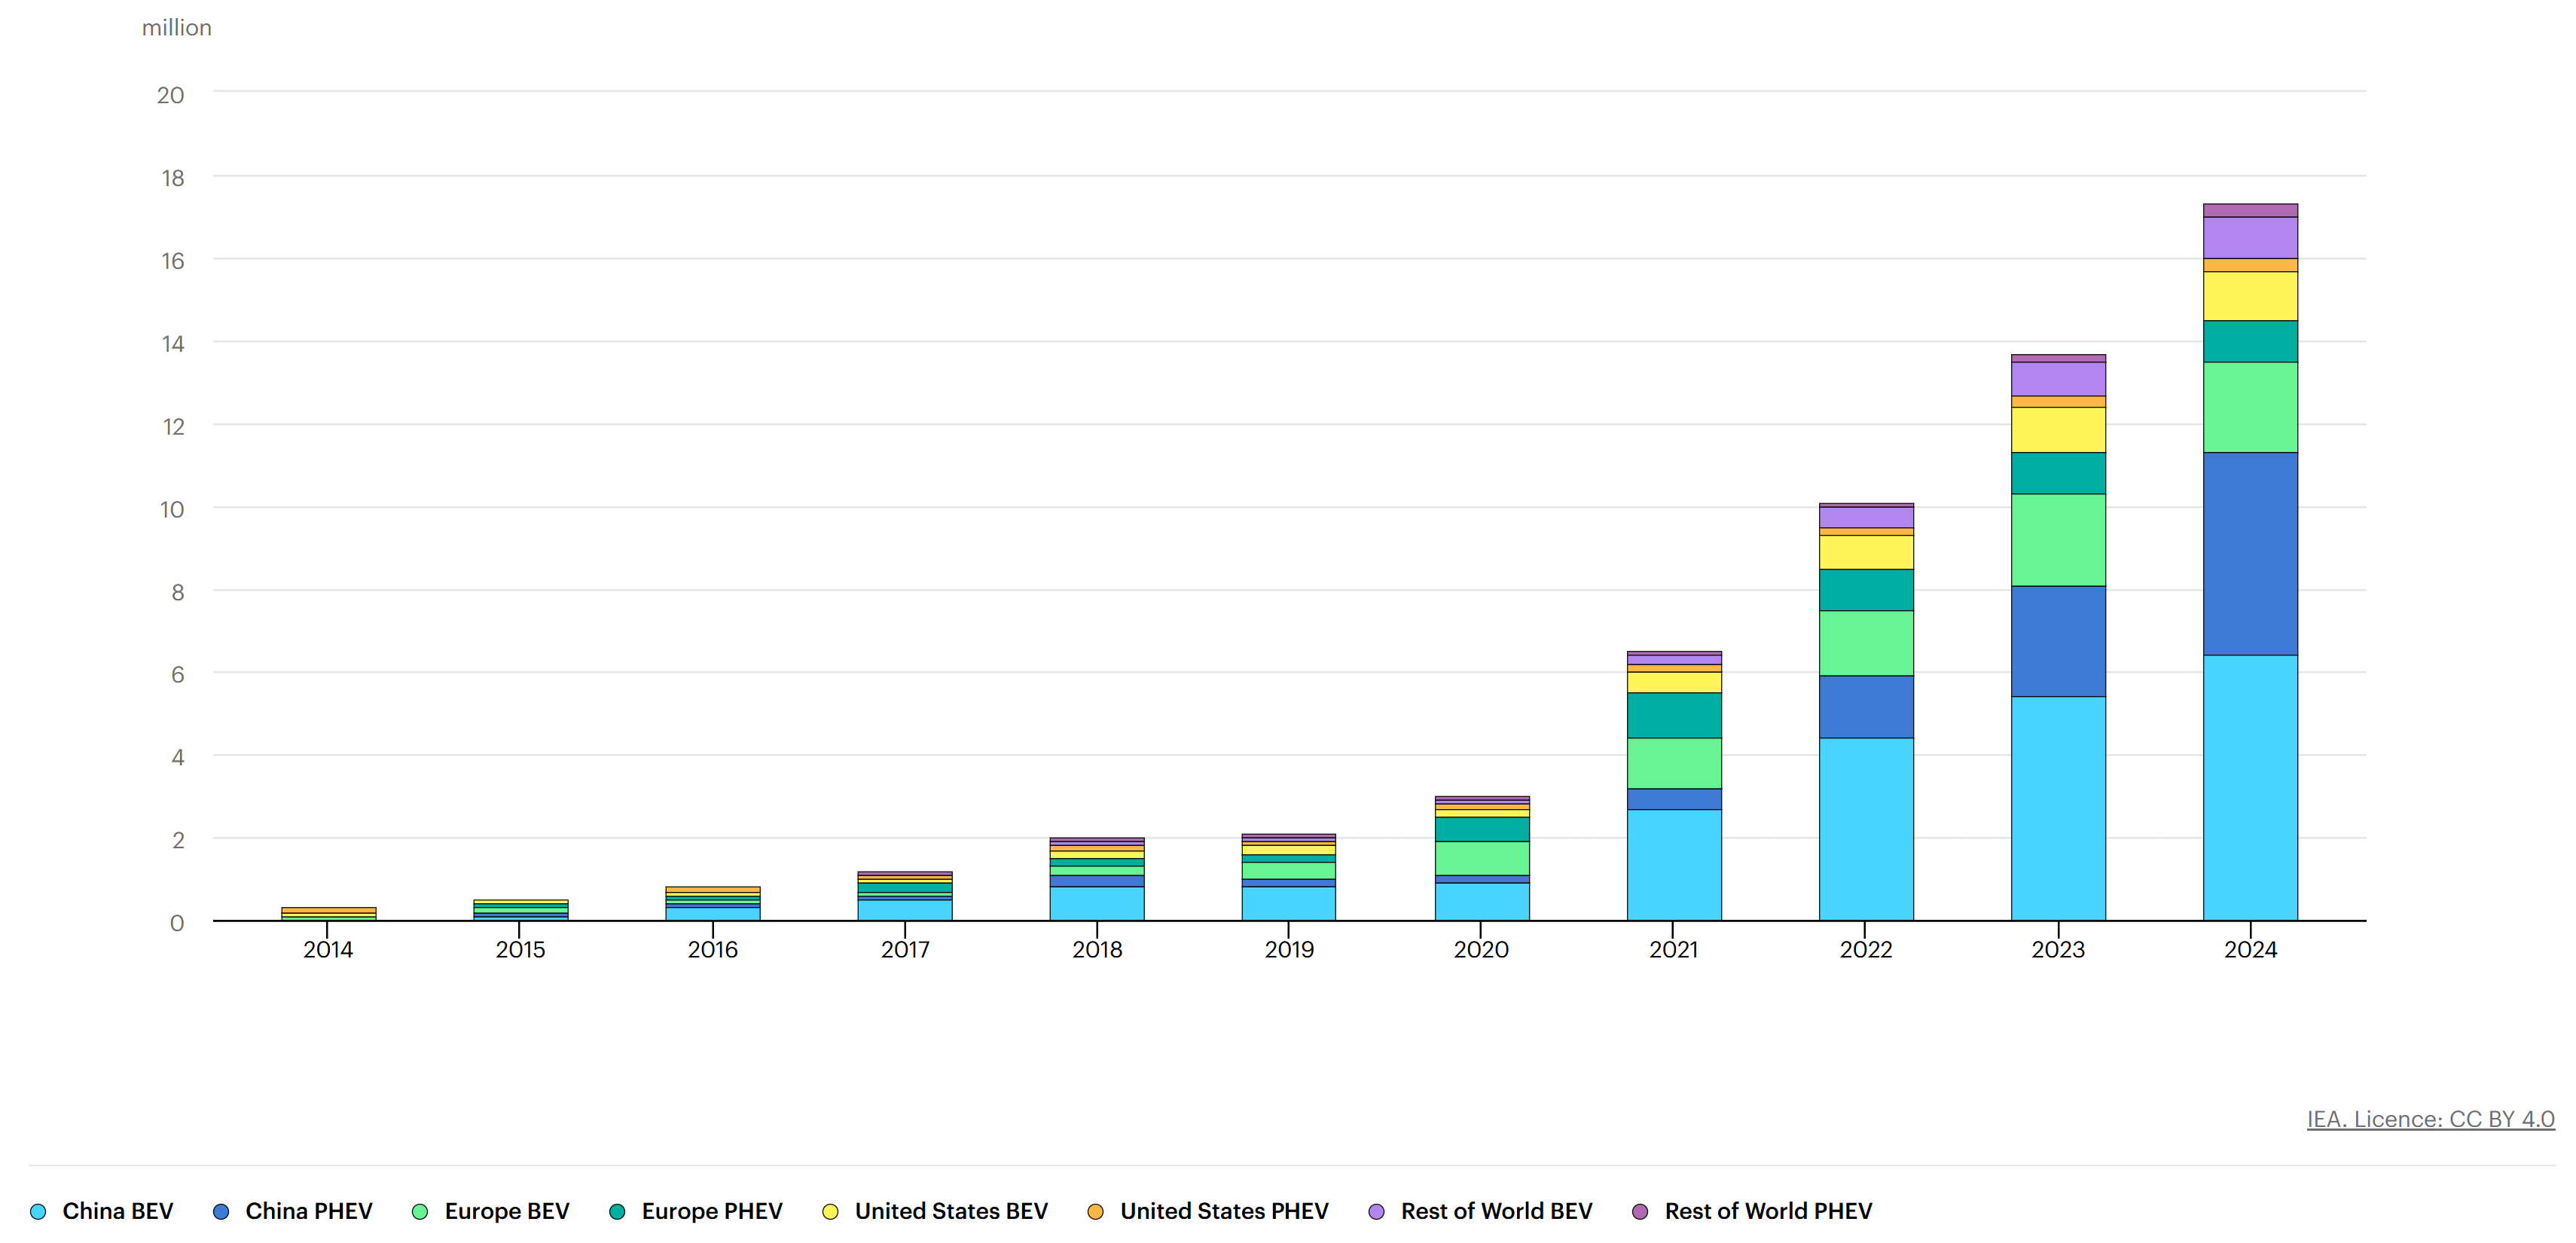
Global BEV vs. PHEV Trends
Top EV Models Comparison - China vs U.S. Markets
Click on brand names for detailed analysis. Hover over ANY CELL in a row for highlighting. Click column headers for definitions.
| Brand/Model | Market | Market Share (%) | Annual Sales (Units) | Price Range (USD) | Vehicle Type |
|---|---|---|---|---|---|
| Tesla Model Y | U.S. | 25.8% | 336,000 | $47,740 - $56,630 | Compact SUV |
| BYD Seagull | China | 18.5% | 2,035,000 | $9,698 - $12,145 | Compact Car |
| Tesla Model 3 | U.S. | 15.2% | 198,000 | $38,990 - $50,990 | Mid-size Sedan |
| BYD Qin Plus | China | 14.2% | 1,562,000 | $13,500 - $18,200 | Compact Sedan |
| Chevrolet Equinox EV | U.S. | 6.8% | 88,500 | $34,995 - $43,295 | Compact SUV |
| Wuling Hongguang Mini | China | 6.5% | 715,000 | $4,200 - $5,600 | Mini Car |
| Ford Mustang Mach-E | U.S. | 3.9% | 51,000 | $48,100 - $63,500 | Mid-size SUV |
| Li Auto L9 | China | 3.7% | 407,000 | $48,900 - $52,400 | Full-size SUV |
| Ford F-150 Lightning | U.S. | 2.5% | 33,150 | $49,995 - $76,995 | Full-size Pickup |
| NIO ES6 | China | 2.1% | 231,000 | $46,500 - $58,200 | Mid-size SUV |
| Hyundai IONIQ 5 | U.S. | 1.8% | 24,500 | $41,245 - $56,395 | Mid-size SUV |
| XPeng P7 | China | 1.6% | 176,000 | $32,100 - $42,800 | Mid-size Sedan |
Market Overview Comparison - China vs United States
Key market metrics comparing the two largest EV markets globally. Click on metrics for detailed explanations.
| Market Metric | China (2024) | United States (2024) | Ratio (China/U.S.) | Market Implications |
|---|---|---|---|---|
| Total EV Sales (Units) | 11,000,000+ | 1,300,000 | 8.5:1 | China's massive scale advantage drives global leadership |
| EV Market Penetration | 35%+ of auto sales | 7% of auto sales | 5.0:1 | China leads in consumer adoption rates |
| Average EV Price (USD) | $15,000-25,000 | $45,000-55,000 | 0.4:1 | Price gap is key adoption driver |
| Global EV Market Share | 60%+ | 8% | 7.5:1 | China dominates global production and sales |
| Leading EV Brands | BYD, Tesla, Li Auto, NIO | Tesla, GM, Ford, Hyundai | N/A | Mix of domestic and international competition |
| Primary Market Strategy | Mass market accessibility | Premium feature differentiation | N/A | Fundamentally different market approaches |
EV Technology Preference Analysis - BEV vs PHEV Trends
Quarterly comparison showing market preference for Battery Electric Vehicles vs Plug-in Hybrids
| Quarter | Market | BEV Sales | PHEV Sales | Total EV Sales | BEV Preference % | BEV Growth Trend |
|---|---|---|---|---|---|---|
| Q1 2024 | China | 2,200,000 | 520,000 | 2,720,000 | 81% | +12% |
| Q1 2024 | U.S. | 268,000 | 88,000 | 356,000 | 75% | +8% |
| Q2 2024 | China | 2,650,000 | 470,000 | 3,120,000 | 85% | +20% |
| Q2 2024 | U.S. | 295,000 | 95,000 | 390,000 | 76% | +10% |
| Q3 2024 | China | 2,980,000 | 420,000 | 3,400,000 | 88% | +12% |
| Q3 2024 | U.S. | 322,000 | 98,000 | 420,000 | 77% | +9% |
| Q4 2024 | China | 3,170,000 | 380,000 | 3,550,000 | 89% | +6% |
| Q4 2024 | U.S. | 341,000 | 103,000 | 444,000 | 77% | +6% |
Interactive Guide - How to Use This Analysis Tool
Example 1: Market Leadership Comparison
Examine leading models by selecting Tesla Model Y (25.8% U.S. share) and BYD Seagull (18.5% China share). The contrast is clear: Tesla appeals to premium U.S. buyers with pricing above $47,000, while BYD dominates the Chinese mass market with affordable models ranging from $9,000–$12,000.
Interactive Demo: Click either highlighted model to activate animated row highlighting and display a detailed competitive analysis in the message box below the main table.
Example 2: Technology Preference Analysis
Explore technology adoption by comparing China's 89% BEV preference in Q4 with the U.S. at 77% BEV adoption. The technology table highlights China's accelerating shift toward fully electric vehicles, while U.S. adoption remains moderated by consumer concerns over driving range and charging infrastructure.
Try this: Click the highlighted percentages to trigger animated highlighting in the technology preference table and view insights into BEV versus PHEV adoption trends.
Understanding the Interactive Features
This tool integrates several interactive elements for deeper analysis: Hover over any cell in the main table to highlight the full row and spotlight the core metric (Market Share). Click on column headers with tooltips to access precise definitions. Finally, use the glossary section to reveal animated definitions by hovering over key terms.
Key Strategic Insights
Scale Advantage: China's 8.5:1 sales lead generates powerful economies of scale, driving down unit costs, accelerating affordability, and enabling faster cycles of technological innovation.
Market Philosophy: China advances an “EVs for everyone” approach centered on accessibility and mass adoption, whereas the U.S. market emphasizes premium positioning, larger vehicle formats, and performance differentiation.
Technology Adoption: While both markets favor BEVs over PHEVs, China demonstrates a sharper acceleration toward fully electric vehicles, with BEVs representing 89% of sales compared to 77% in the U.S.
Strategic Summary
Pace of Growth
China continues to expand at an extraordinary pace, while the U.S. demonstrates steady but measured growth in EV adoption.
Policy & Incentives
China accelerates adoption through direct subsidies and industrial policy, whereas the U.S. emphasizes federal tax credits and state-level incentives.
Consumer Concerns
Affordability remains the decisive factor for Chinese buyers, while U.S. consumers are primarily influenced by concerns over driving range and charging reliability.
Model Variety
China offers a broad spectrum of affordable, compact EVs for mass-market appeal, while the U.S. market favors larger, higher-priced models with premium features.
Global Position
China dominates EV exports and battery supply chains, while the U.S. continues to shape global technology standards and brand perception.
Charging Infrastructure
China rapidly scales nationwide public charging networks, while U.S. investment focuses on expanding highway fast-charging corridors.
Glossary & Key Terms
Hover over any term to reveal its definition. Move your cursor away to collapse the explanation.
- Market Share (%)
- The proportion of total EV sales in a given market accounted for by a specific brand or model. Calculated by dividing individual sales by total market sales, it is the core metric used for comparison.
- Annual Sales (Units)
- The number of EVs sold by a brand or model within the 2024 calendar year. Figures include both domestic sales and exports, representing overall production delivered to consumers.
- Price Range (USD)
- The manufacturer’s suggested retail price (MSRP) range, converted into U.S. dollars for consistency. Values may differ across regions due to tariffs, local incentives, or market conditions.
- BEV (Battery Electric Vehicle)
- A vehicle powered entirely by an electric motor and battery pack, with no combustion engine. BEVs must be recharged from external power sources and represent the fully electric segment.
- PHEV (Plug-in Hybrid Electric Vehicle)
- A vehicle that combines an electric motor with a combustion engine. PHEVs can operate in electric-only mode for short distances before transitioning to hybrid operation when the battery is depleted.
- Market Penetration
- The percentage of overall auto sales represented by EVs in a market. Higher penetration signals greater adoption, infrastructure maturity, and cultural acceptance of electrification.
- Vehicle Type Classification
- Categories based on size and market role: Mini Car (urban use), Compact (mainstream market), Mid-size (family vehicles), Full-size (luxury and performance), and specialty classes such as pickup trucks.