China vs U.S. Electric Vehicle Markets
An Interactive Analysis of the World's Two Largest EV Markets
China and the United States represent two fundamentally different approaches to electric vehicle adoption. China dominates through mass accessibility, while the U.S. focuses on premium innovation.
This presentation explores the key differences in market size, pricing strategies, consumer adoption, and the strategic implications for global electrification.
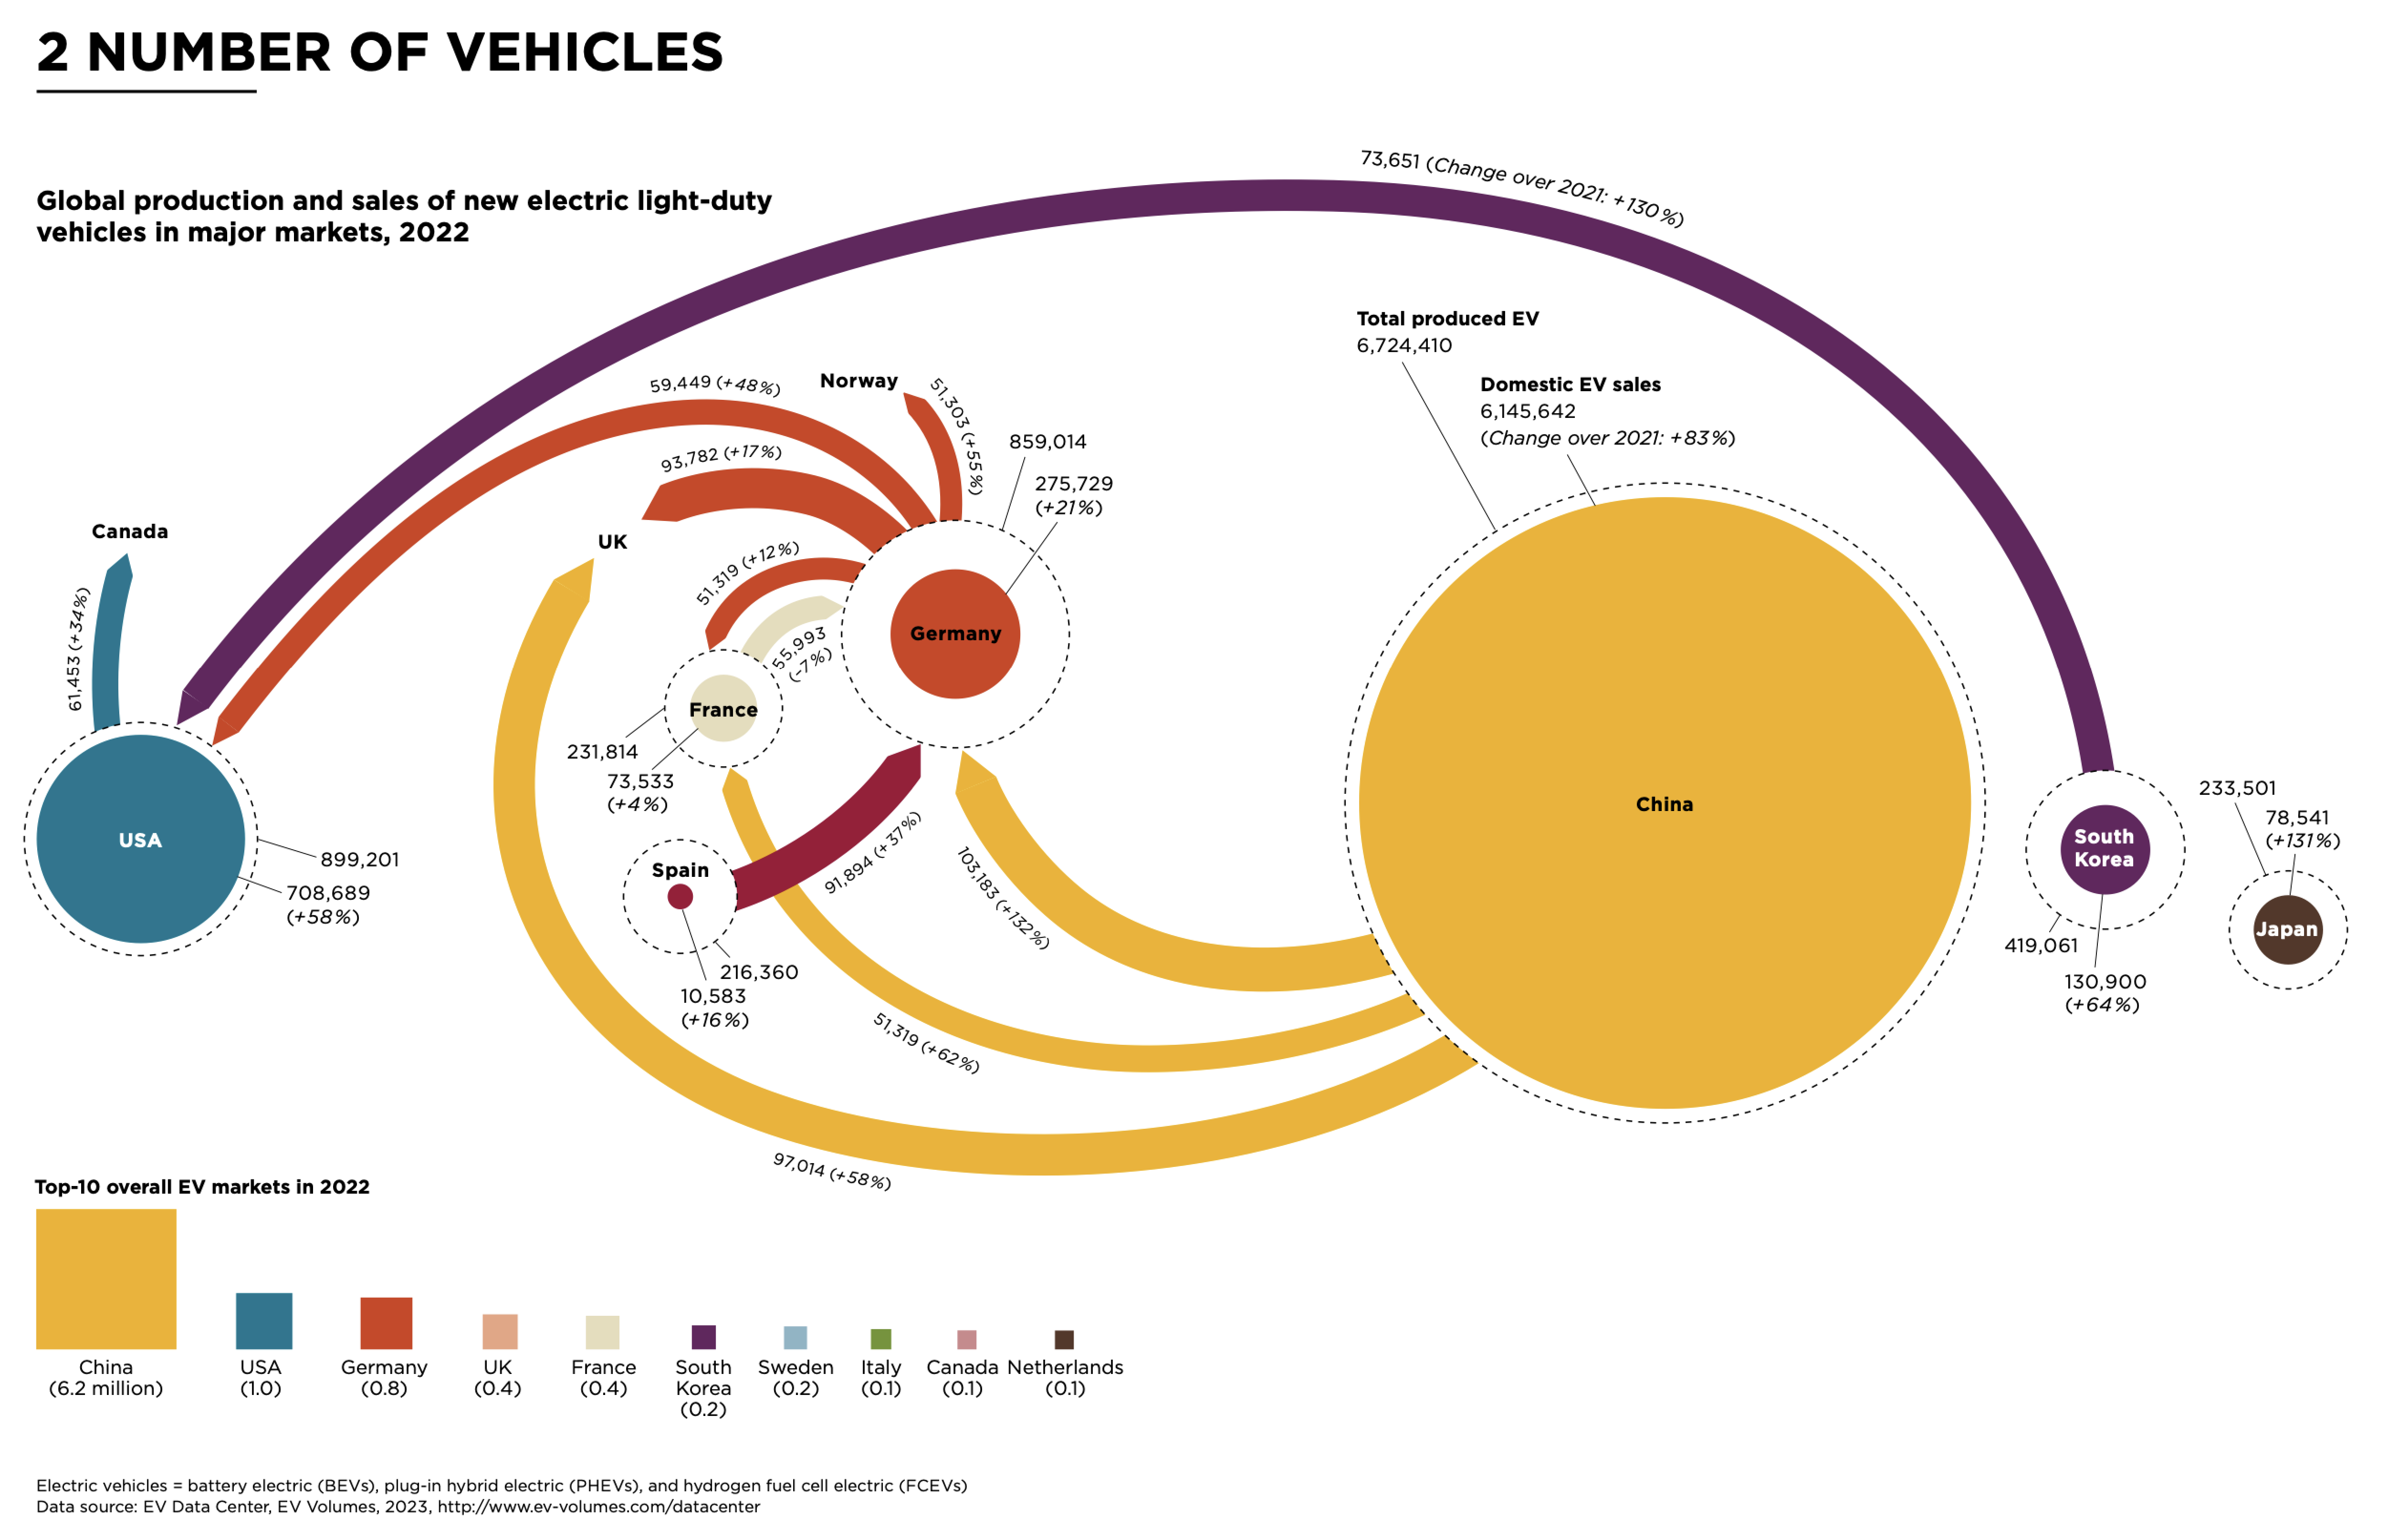
Market Scale: The Numbers Tell the Story
Annual EV Sales (2024)
35%+ of all new car sales
Annual EV Sales (2024)
7% of all new car sales
Scale Advantage: China's massive volume creates powerful economies of scale, driving down costs and accelerating innovation cycles.
| Market Metric | China (2024) | United States (2024) | Ratio (CN/US) | Market Implications |
|---|---|---|---|---|
| Total EV Sales | 11,000,000+ units | 1,300,000 units | 8.5:1 | China's scale drives global leadership |
| Market Penetration | 35%+ of auto sales | 7% of auto sales | 5.0:1 | Adoption gap widens annually |
| Average Price | $15,000-25,000 | $45,000-55,000 | 0.4:1 | Accessibility vs Premium positioning |
| Global Market Share | 60%+ | 8% | 7.5:1 | China dominates production |
| Charging Stations | 2.5M+ public chargers | 140,000 public chargers | 18:1 | Infrastructure advantage |
Pricing Philosophy: Two Different Strategies
The price gap between markets reveals fundamentally different strategic approaches to EV adoption.
Average EV Price Range
Top Models:
- BYD Seagull: $9,700 - $12,100
- Wuling Mini: $4,200 - $5,600
- BYD Qin Plus: $13,500 - $18,200
Average EV Price Range
Top Models:
- Tesla Model Y: $47,740 - $56,630
- Ford Mach-E: $48,100 - $63,500
- F-150 Lightning: $49,995 - $76,995
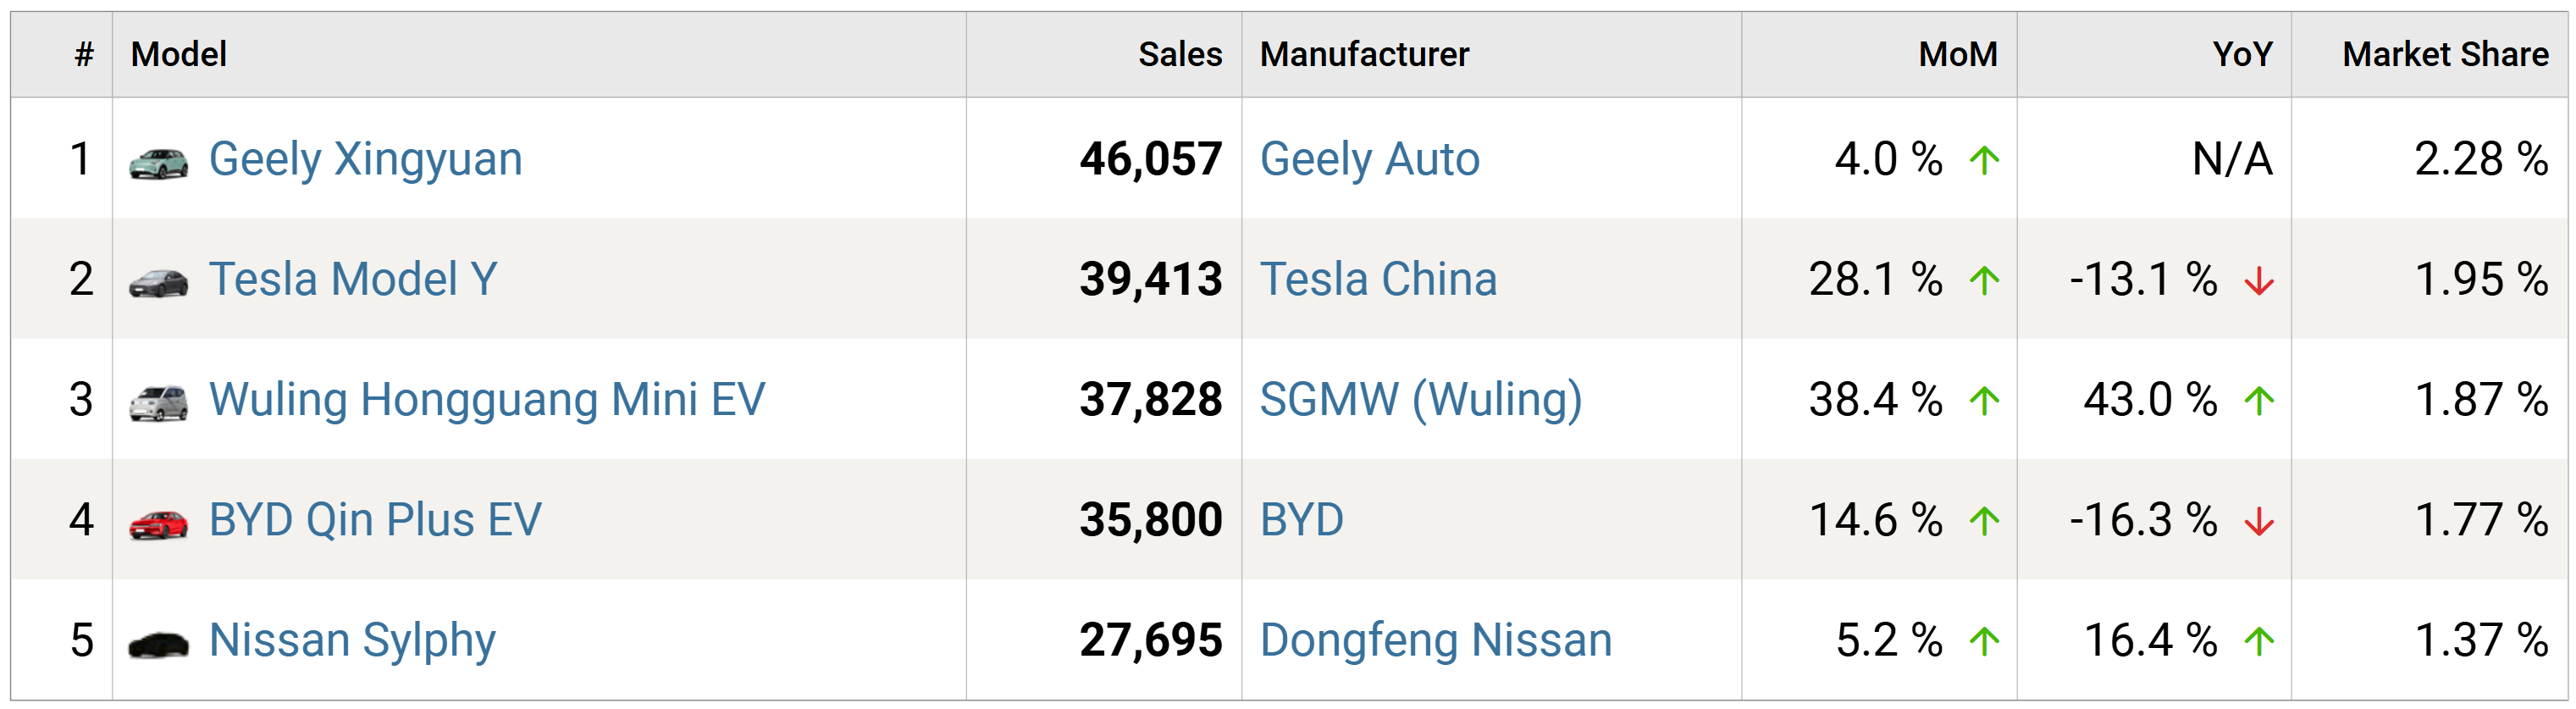
Top EV Models: China vs United States
Leading models by market share and sales volume in each region
| Brand/Model | Market | Market Share (%) | Annual Sales | Price Range (USD) | Type |
|---|---|---|---|---|---|
| Tesla Model Y | US | 25.8% | 336,000 | $47,740 - $56,630 | Compact SUV |
| BYD Seagull | China | 18.5% | 2,035,000 | $9,698 - $12,145 | Compact Car |
| Tesla Model 3 | US | 15.2% | 198,000 | $38,990 - $50,990 | Mid-size Sedan |
| BYD Qin Plus | China | 14.2% | 1,562,000 | $13,500 - $18,200 | Compact Sedan |
| Chevrolet Equinox EV | US | 6.8% | 88,500 | $34,995 - $43,295 | Compact SUV |
| Wuling Hongguang Mini | China | 6.5% | 715,000 | $4,200 - $5,600 | Mini Car |
| Ford Mustang Mach-E | US | 3.9% | 51,000 | $48,100 - $63,500 | Mid-size SUV |
| Li Auto L9 | China | 3.7% | 407,000 | $48,900 - $52,400 | Full-size SUV |
| Ford F-150 Lightning | US | 2.5% | 33,150 | $49,995 - $76,995 | Full-size Pickup |
| NIO ES6 | China | 2.1% | 231,000 | $46,500 - $58,200 | Mid-size SUV |
| Hyundai IONIQ 5 | US | 1.8% | 24,500 | $41,245 - $56,395 | Mid-size SUV |
| XPeng P7 | China | 1.6% | 176,000 | $32,100 - $42,800 | Mid-size Sedan |
Key Insight: China's "EVs for Everyone" approach prioritizes accessibility and mass adoption, while the U.S. market emphasizes premium positioning, larger formats, and performance differentiation.
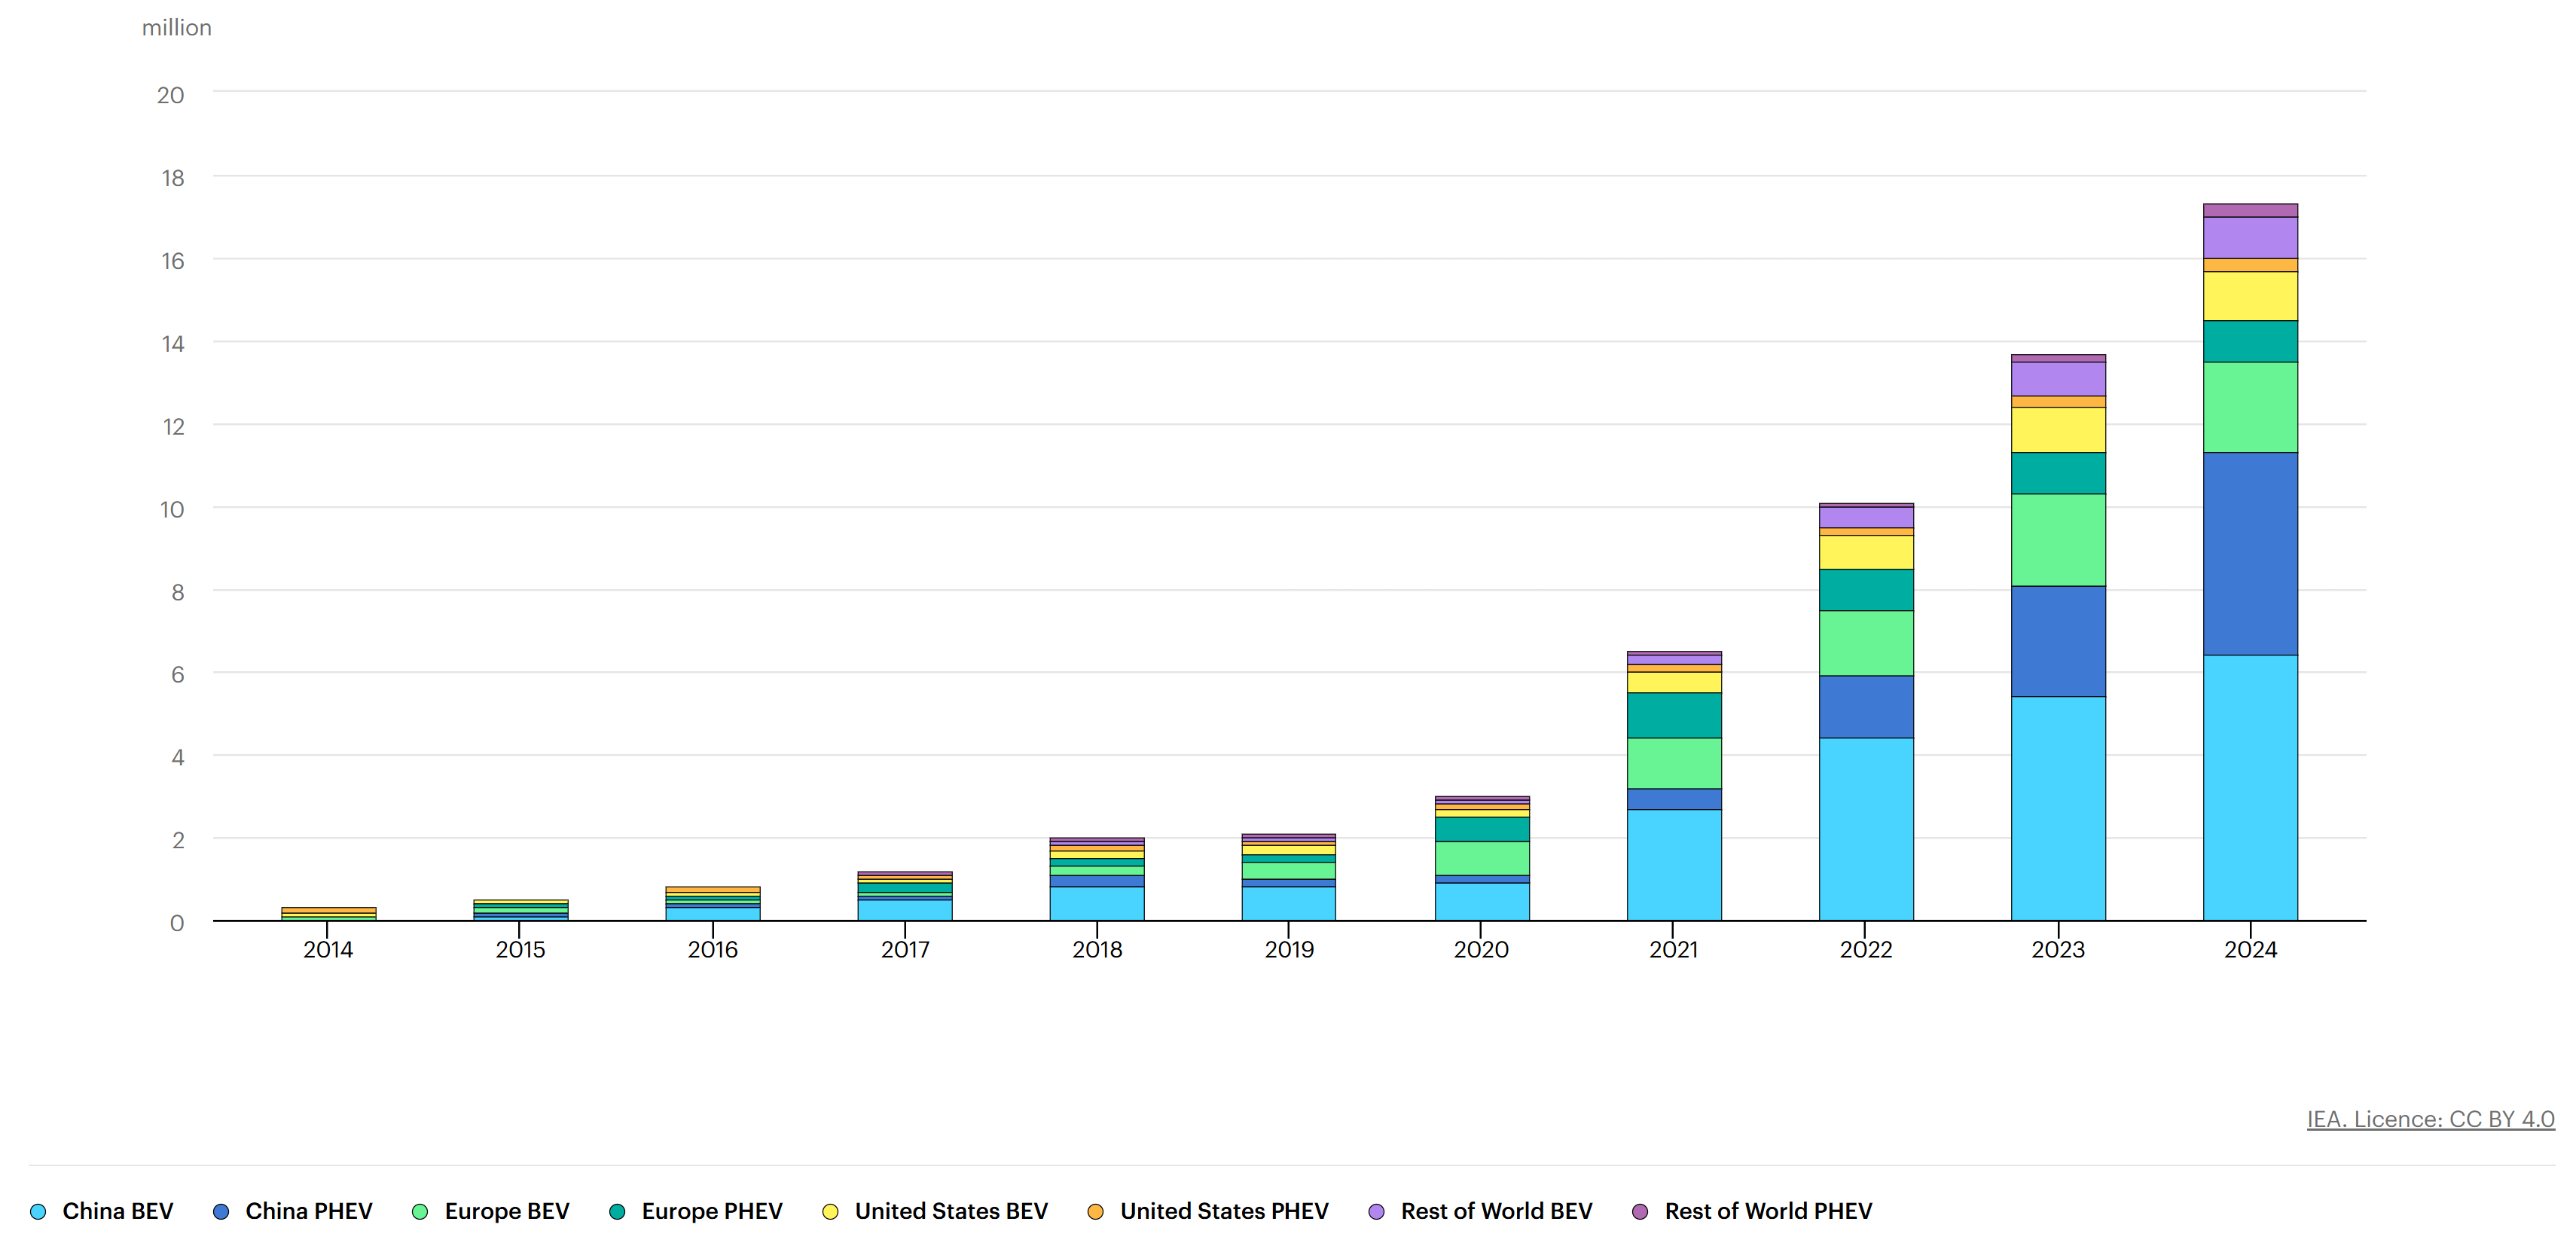
Technology Trends: BEV vs PHEV
Both markets favor fully electric vehicles (BEVs), but China shows stronger acceleration toward complete electrification.
| Quarter | Market | BEV Sales | PHEV Sales | Total EV Sales | BEV Preference % | BEV Growth Trend |
|---|---|---|---|---|---|---|
| Q1 2024 | China | 2,200,000 | 520,000 | 2,720,000 | 81% | +12% |
| Q1 2024 | U.S. | 268,000 | 88,000 | 356,000 | 75% | +8% |
| Q2 2024 | China | 2,650,000 | 470,000 | 3,120,000 | 85% | +20% |
| Q2 2024 | U.S. | 295,000 | 95,000 | 390,000 | 76% | +10% |
| Q3 2024 | China | 2,980,000 | 420,000 | 3,400,000 | 88% | +12% |
| Q3 2024 | U.S. | 322,000 | 98,000 | 420,000 | 77% | +9% |
| Q4 2024 | China | 3,170,000 | 380,000 | 3,550,000 | 89% | +6% |
| Q4 2024 | U.S. | 341,000 | 103,000 | 444,000 | 77% | +6% |
Analysis: China's accelerating shift toward pure electric vehicles reflects greater consumer confidence in charging infrastructure and range capabilities. U.S. adoption remains moderated by range anxiety and charging availability concerns.